
2026-10-09 APP 2.0.0-beta48 has been released !
This is mainly a bug fix release for the reported bugs in beta47. In addition it has a significant User Interface performance improvement noticable when you need to process 1000s of images in APP.
2026-10-03 APP 2.0.0-beta47 has been released !
This is a very big release... many code optimizations/rewrites, many parts of APP are much faster and more precise, especially star analysis and registration are much faster ! Big mosaics will go much faster 🙂
And we introduce a new preview filter, which includes the new Adaptive Deep Sky Stretch and a General Levels Stretch, this has been long over due. The old preview filter (the panel on the right side to stretch and preview your data) has not been updated for a couple of years and it is a critical part of any APP session.
Adaptive Deep Sky Stretch or ADSS is a much more intuitive stretch algorithm. It is also color preserving (which is a great new addition in itself ! ) which means that the highlights are no longer bleached, color is maintained from the linear data while stretching. You can simply stretch your data using the sky background level and signal width sliders which work much easier and more intuitive. You no longer need to fiddle with the old complicated sliders with zoom buttons. All the zoom buttons for the sliders are made redundant. And you can enter slider values in the slider value fields yourself. I will make a youtube video in the coming days to explain and fully introduce ADSS. Once the video is ready, it will be highlighted on the forum.
RGB Combine upgrade !. The RGB Combine Tool has been rewritten mostly. The tool is faster and easier to use and most importantly, the Luminance slider to inject a luminance channel or channels into the RGB composite is now working correctly. It no longer bleaches the RGB colors. Combined with the new ADSS preview, you will get much better and easier great composites with great color! I will also explain this in a new youtube video.
Not really sure how to best explain this, but I notice that frequently, the program just... halts randomly in the middle of integration. I am now trying to stack 506 images for the third time. First time it stopped at 186/506, now it stopped processing at 104/506.
Sometimes I can still interact with the menu and the "cancel" button will works so the program itself hasn't frozen, but it just stops processing. Other times, pressing cancel does nothing and I have to exit the entire program. By doing so, I have to start over adding all of the sessions again.
This time, pressing cancel (seemingly) did nothing, but I kept it in the background while typing this post, heard the "GONG" in the background and the process had cancelled. Took several minutes from pressing cancel until it actually cancelled.
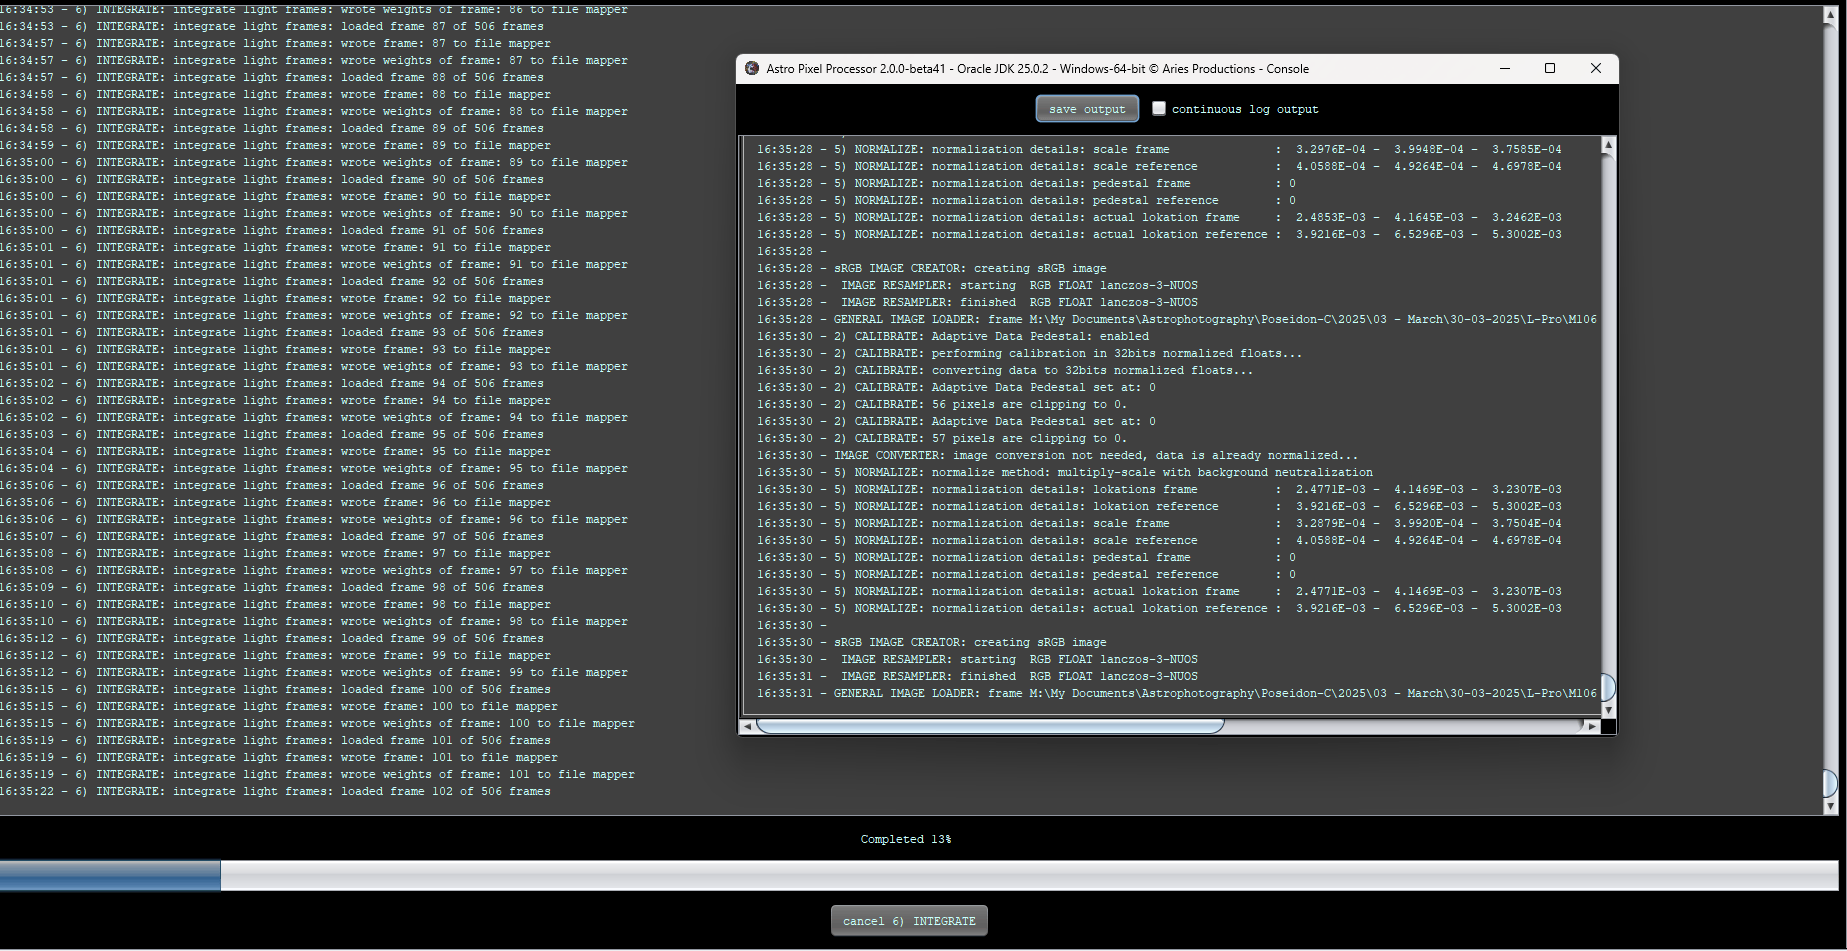
Sometimes it goes through fine, usually during the second attempt, but this time I am now at my third. I experienced this with the previous version too (Beta39), but only "now and then".
Running Widows 11 25H2 ver 8246
64 GB RAM
AMD Ryzen 9 7950x 16-core
Usually it integrates 1, maybe 2 frames per second with that setup, until it suddenly stops dead in its tracks and goes several minutes without doing anything. Last time I waited for 10 minutes to see if a background process was catching up, but it was left at 186/506 for all that time.
Anyone else experienced similar and know of a fix?
Third time it went through, but now it has instead been stuck here for 20 minutes at 100% CPU with no apparent progress
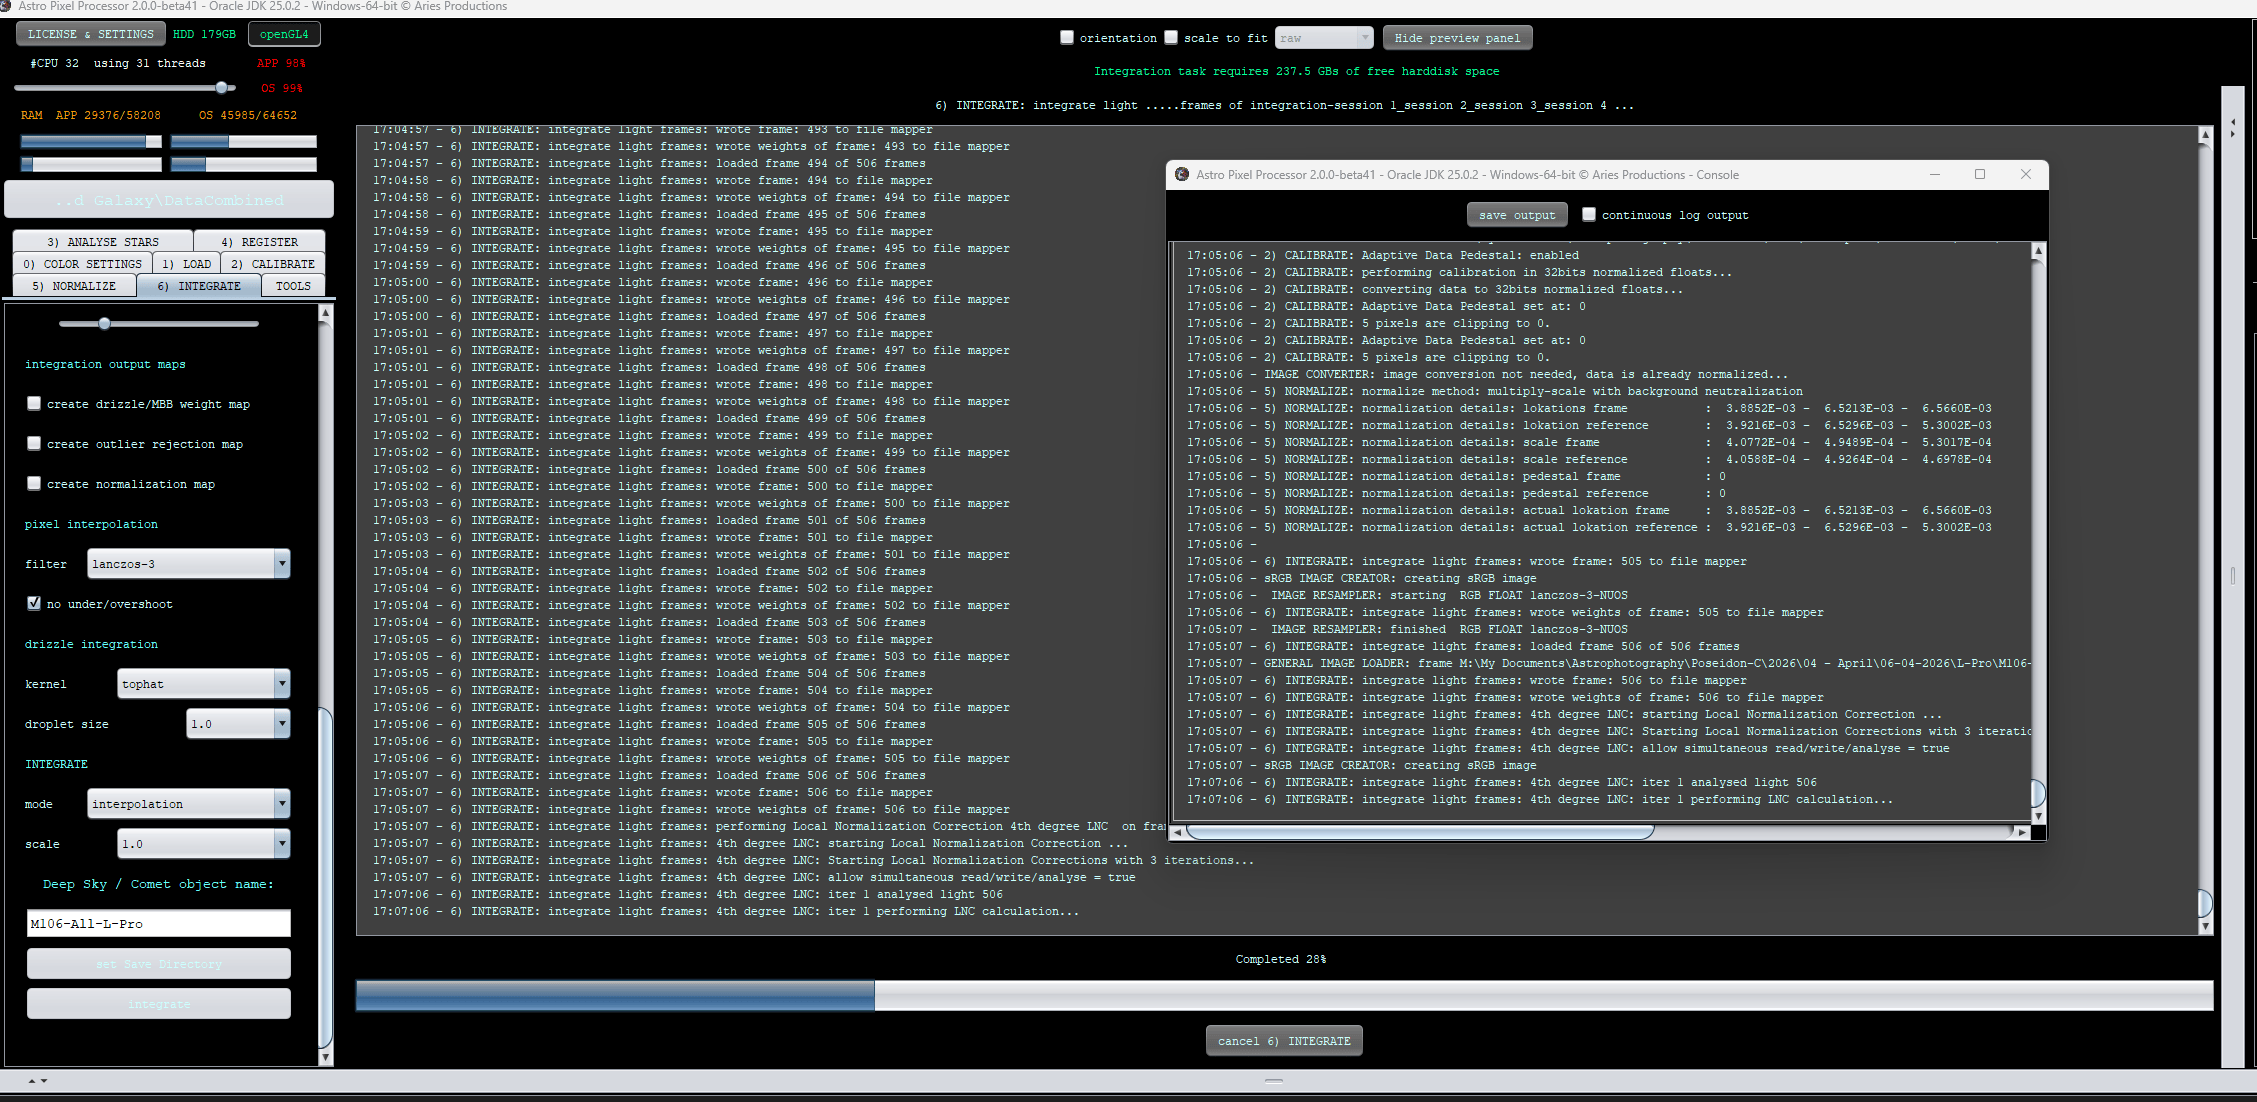
Will let it run for 5 more minutes then I cancel, because I am fearing for the health of my CPU at this point.
I have not had any problems like this earlier, but I don't know how to troubleshoot this either.
Hi Wheeljack, @wheeljack
Thank you very much for reporting this. That all sounds a bit like a problem with internal memory management getting stuck/needing to do a lot of cleaning work but not able to do it somehow. I will have a good look and will do some related testing. We have moved to a newer development platform and that would explain this somehow. I can send you a test version that will do this differently okay? Then you can test if it works as expected.
Only running APP on Windows? (then I only need to make a windows test version for you)
Mabula
Wow! That was quick.
Yes, only using Windows. I can happily test for you if needed.
Great, thanks @wheeljack,
I will try to provide a test version in the coming days for you. I will change the internal memory configuration and then we should be able to make it work stable again.
Mabula
Update: I saw that beta42 was available, so I went ahead and tried that one.
This is indeed major improvements, it seemed to (on average) use less resources but not at the cost of speed. I went all-in and added 724 light-frames (180s each), from 7 different sessions, each with their own calibration frames. I also used 4th degree LNC with 3 iterations.
The process started fine, but ran into issues near the end.
The integration process stopped briefly for almost 30 seconds around frame 530-ish, but eventually continued and then it froze for almost 2 minutes at roughly 620 frames before it again froze for a minute at frame 626
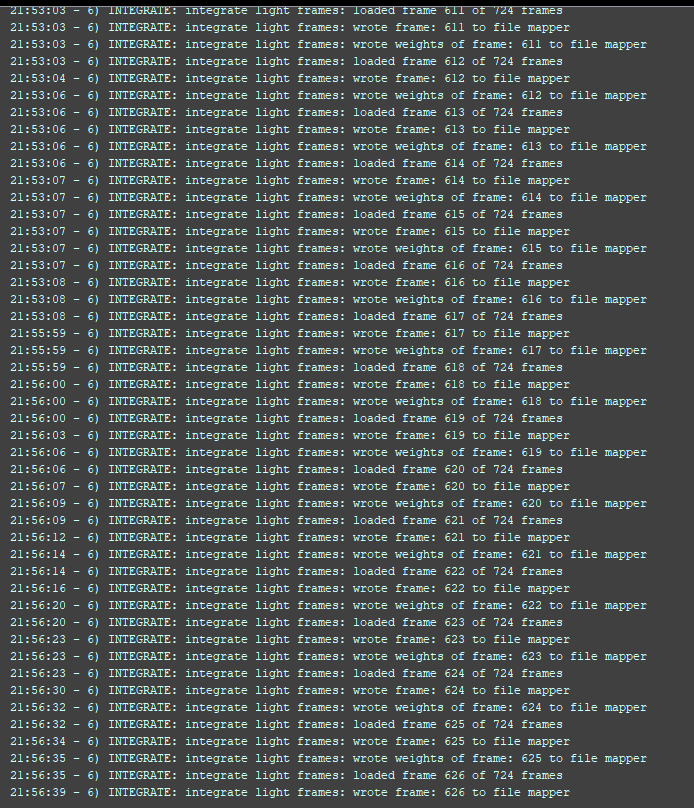
When it continued, it again halted at 644 frames and was stuck there for 3 minutes
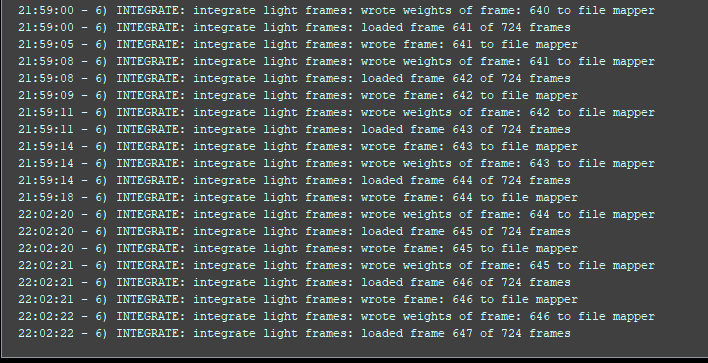
Went at the normal speed again (roughly 1-2 frames pr second) and again it froze up at 661 frames for another minute and a half.
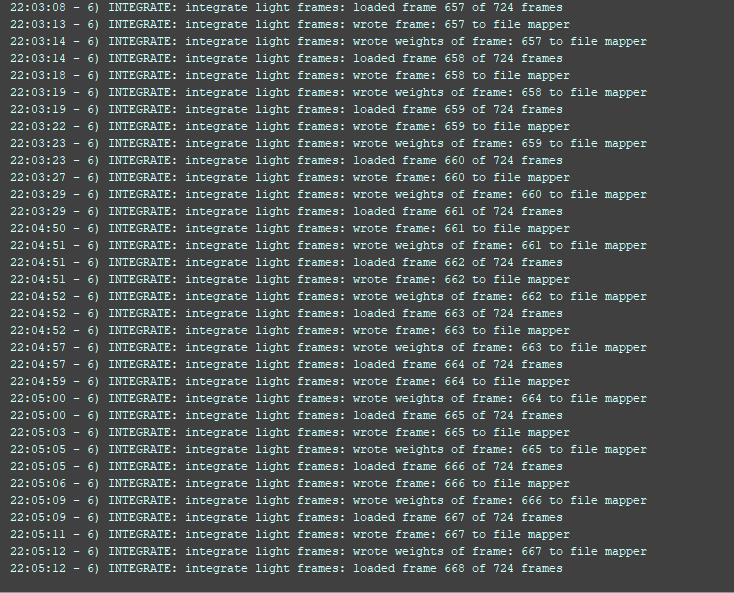
After that, it froze for about 1-3 minutes every 10-ish frames until it completed the integration.
It went through the first LNC iteration, but has now been stuck at the calculation for 15 minutes with no apparent progress.
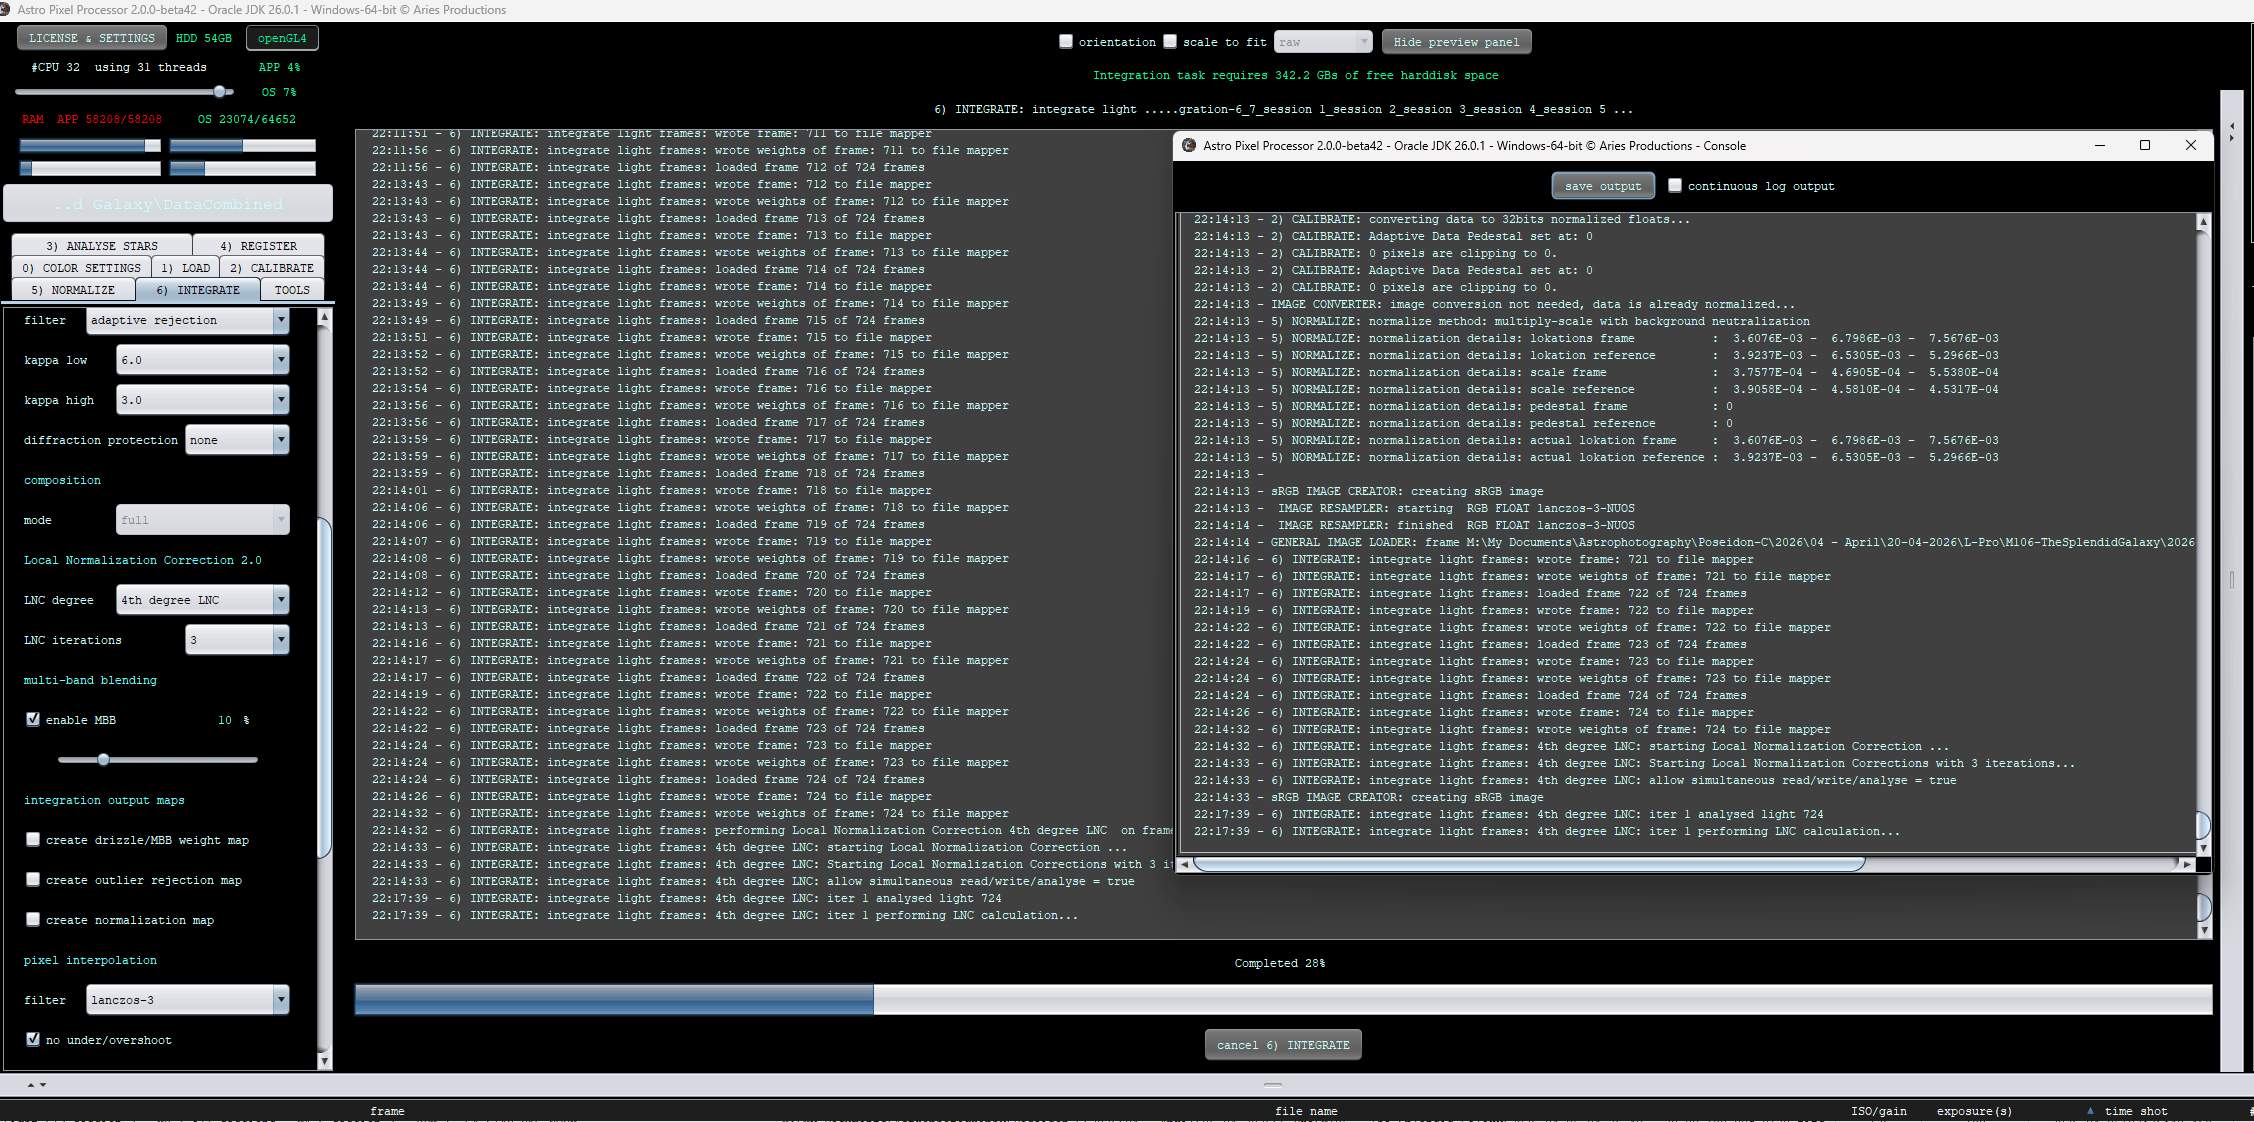
It appears to no longer be trying to do something, as my CPU fans calmed down and APP is hardly using any resources anymore. Yet It still hasn't progressed any further so I manually cancelled after about an hour and a half (in total)
Hi @wheeljack,
Thank you very much for sharing this.
Hmm, that really sounds like a big memory issue internally somehow, think the internally memory gets very fragmented. Can you possible upload the whole dataset so I can give it a spin on different computers with different Operating Systems.
I can also change some internal memory settings and provide you a test version tomorrow to see if that solves it?
What do you prefer? If you want to upload the data, I will work on it as soon as it is uploaded.
https://upload.astropixelprocessor.com/
username: uploadData
password: uploadTestData
Please make a folder with your name and issue like : Wheeljack-process-stalls
and upload the data there.
Thanks!
Mabula
Thanks alot Mabula.
They're on their way now, but I reached a upload-limit so I couldn't upload any of the darks and only half of the Bias frames. (Not sure if they're even needed for your testing though so they may not even be that important)
Hi Wheeljack,
Great, I already did some testing today on a set with 500 images. I think I know what the issue is. The recent optimizations have made APP quite a bit faster and now memory clean up becomes a big problem with the current internal memory configuration. So the clean up can not hold on to the amount of GBs that are processed. The current configuration was indeed completely fragmenting internal memory and the stalls then start to appear because of the fragmentation.
This sounds dramatic, but I think that I have already good news 🙂
There is a way to avoid fragmentation completely with a different internal approach. I was just testing this afternoon and it seems to be much better already. I was able to process the 500 frames without any slowdown and very fast. Memory usage stayed even below 10GB most of the time. Beta42 was taken 30-40 GB at some point..
I will build a test version for Windows and when it is ready, I will share it with you so you can test it quickly 😉
Mabula
Hi @wheeljack,
Please try this test version with a very different internal memory configuration. I did several tests and all were very solid with large datasets and fast, technically it definitely solves the problem if I analyzed it correctly. It could very well be that this new configuration is the way forward from here 😉
DOWNLOAD 2.0.0-beta43 ZGC test
This version should not stall/freeze at all like you experienced. And memory usage should not exceed 16GB of RAM by much unless processing GigaPixel images. This is what I see and how I configured it for this test release.
Look forward to hear about your testing with this one 😉
Mabula
That was seriously quick response. Thanks alot. Glad to see that you also managed to spot the same (or at least similar) issues that I was. I will install your test-version and run the same dataset again, also with heavy LNC (to reproduce the same conditions) and report back to you. Most likely tomorrow.
Thanks again for your efforts. It really is appreciated.
Got the opportunity to test again, using all the same settings.
Major improvements. Did not experience any stalls or freezes during either of the steps, until it came to LNC Calculations. The entire process (calibration, registration, normalization etc) took less than an hour to complete for all 724 frames, but it has been stuck here now for a little over 30 minutes:
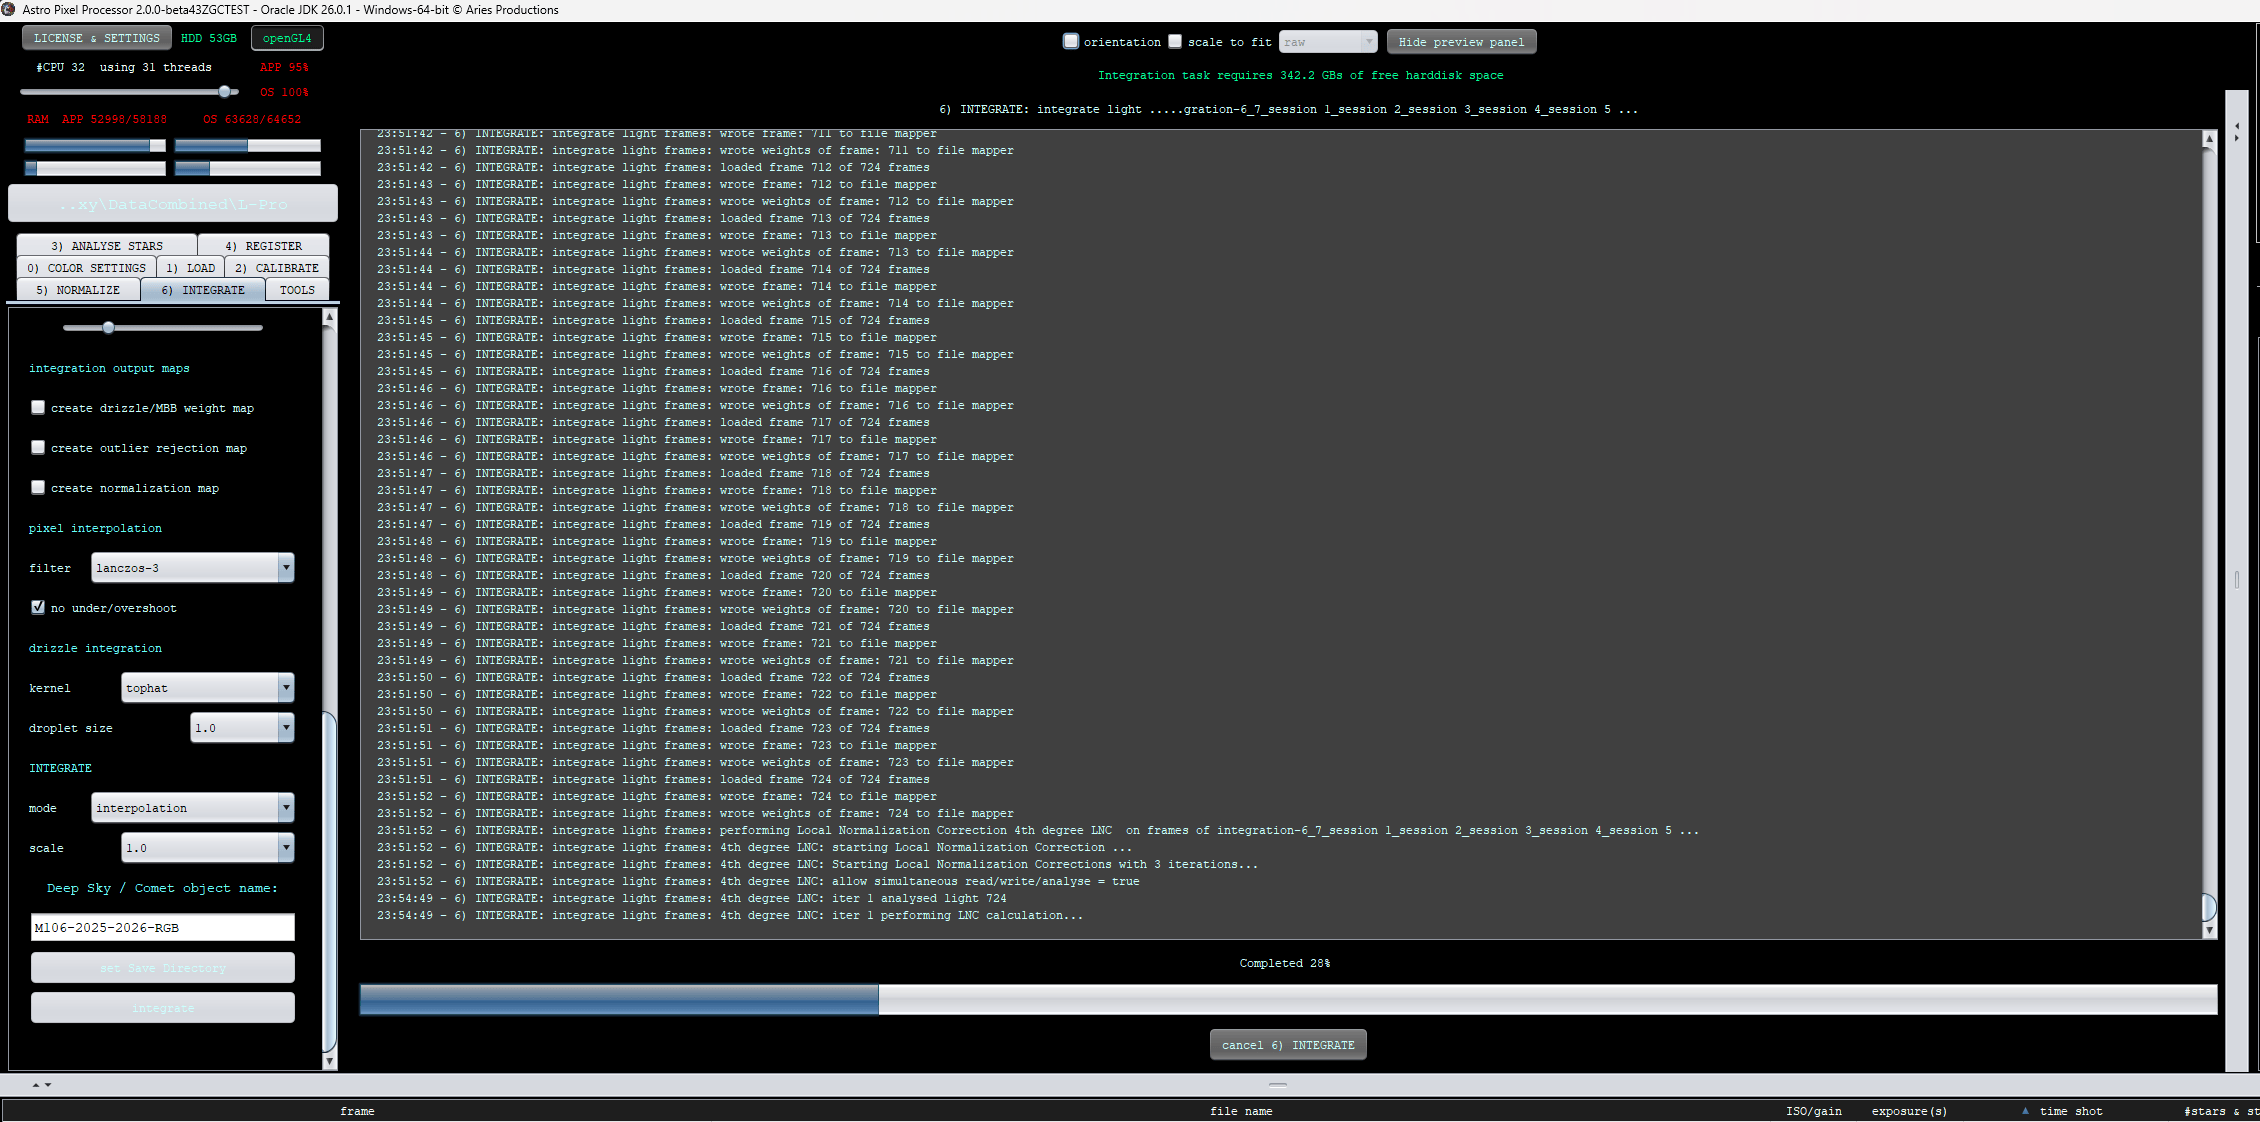
After reaching that stage, it went on for 5-10 minutes, then the process monitors died down, as well as my CPU fans. I let it just linger in the background while I was typing this, for another 20 minutes or so, and suddenly the CPU fans started up again and the process monitor indicated that something started to happen. That has now gone on for another 10 minutes and I am not sure if something is stuck somewhere or if it's actually doing anything.
Prior to trying your new test version, I did try another run using Beta42 with 2nd degree LNC and all of those iterations finished after ~10m each. So might be something with 4th?
I encountered no issues up until this point, so these are still major improvements. I let it work for another few minutes and cancelled after the first iteration of "performing LNC calculations" had ran for a total of 40 minutes.
Attached the console-dump if it's helpful.
Hi @wheeljack,
Awesome ! I think this is all as expected now with regard to stability and APP being able to complete the long tasks. The new memory controls have fixed it. I have done more testing last night and all is very stable and fast now. The memory defragmentation is completely gone.
Calculating the LNC parameters 4th degree for more than 700 frames, does take a while. Part (33%) of the LNC calculation is still single threaded unfortunately so that explains the behaviour, that at some point the fans stop... and then once the single threaded part is done, the fans turn on again, and then the final part is calculated after which the result should be fine. LNC 2nd degree should be faster, less parameters to solve. And LNC 1st much faster.
Beta39 and earlier with the older LNC, was not even able to complete LNC1st degree I think on 700 images, or if it was, it took a huge amount of memory and time.
Thanks for testing ! I will release 2.0.0-beta43 with this fix for all platforms now. (and 2 other fixes).
Mabula
I can stick with 2nd degree LNC. I think that's what I have mostly been using for all these years anyway. I think I only started using 4th a few months ago out of curiosity, but on much smaller stacks (~200 ish) and have just been using it since.
Thanks again for your work with this. Will giive Beta43 a run later today, and set it to 2nd degree LNC instead and continue to be using that (or experiment with differences between 2nd and 1st degree)
Hi @wheeljack,
Okay, great 😉 You are most welcome and thank you very much again for reporting this instability. How did beta43 run?
I will probably make another adjustment today or tomorrow with the new memory configuration, so beta44 can be released in the next day or 2 😉
Mabula
I got to try Beta43 a couple of times, and this is indeed a solid improvement. Even with 2nd degree LNC it did spend a lot of time on the "calculating" step, but as you already pointed out, that was most likely because of the size of the stack (700+ subs). I did do a few multi-NB stacks where I extracted HA and OIII (from a different set of subs, about 170 of them - same target) and did not encounter any issues at all with the stacking. The stacked image came out with horrible gradients (due to poor data) so I got to try the process several times in an effort to find and weed out the bad subs - and each run took only a few minutes to complete.
Hi @wheeljack,
Great that is exactly what we look for, stable, fast and continuous integration on the big tasks 😉 !
I have made further adjustments with the new memory controls in beta44, because it gave a couple of problems with systems with little memory and some warnings on the command line. I think that is all fixed with 2.0.0-beta44 now.
So please update to 2.0.0-beta44 and let me know how that goes.
Mabula
