
2026-10-09 APP 2.0.0-beta48 has been released !
This is mainly a bug fix release for the reported bugs in beta47. In addition it has a significant User Interface performance improvement noticable when you need to process 1000s of images in APP.
2026-10-03 APP 2.0.0-beta47 has been released !
This is a very big release... many code optimizations/rewrites, many parts of APP are much faster and more precise, especially star analysis and registration are much faster ! Big mosaics will go much faster 🙂
And we introduce a new preview filter, which includes the new Adaptive Deep Sky Stretch and a General Levels Stretch, this has been long over due. The old preview filter (the panel on the right side to stretch and preview your data) has not been updated for a couple of years and it is a critical part of any APP session.
Adaptive Deep Sky Stretch or ADSS is a much more intuitive stretch algorithm. It is also color preserving (which is a great new addition in itself ! ) which means that the highlights are no longer bleached, color is maintained from the linear data while stretching. You can simply stretch your data using the sky background level and signal width sliders which work much easier and more intuitive. You no longer need to fiddle with the old complicated sliders with zoom buttons. All the zoom buttons for the sliders are made redundant. And you can enter slider values in the slider value fields yourself. I will make a youtube video in the coming days to explain and fully introduce ADSS. Once the video is ready, it will be highlighted on the forum.
RGB Combine upgrade !. The RGB Combine Tool has been rewritten mostly. The tool is faster and easier to use and most importantly, the Luminance slider to inject a luminance channel or channels into the RGB composite is now working correctly. It no longer bleaches the RGB colors. Combined with the new ADSS preview, you will get much better and easier great composites with great color! I will also explain this in a new youtube video.

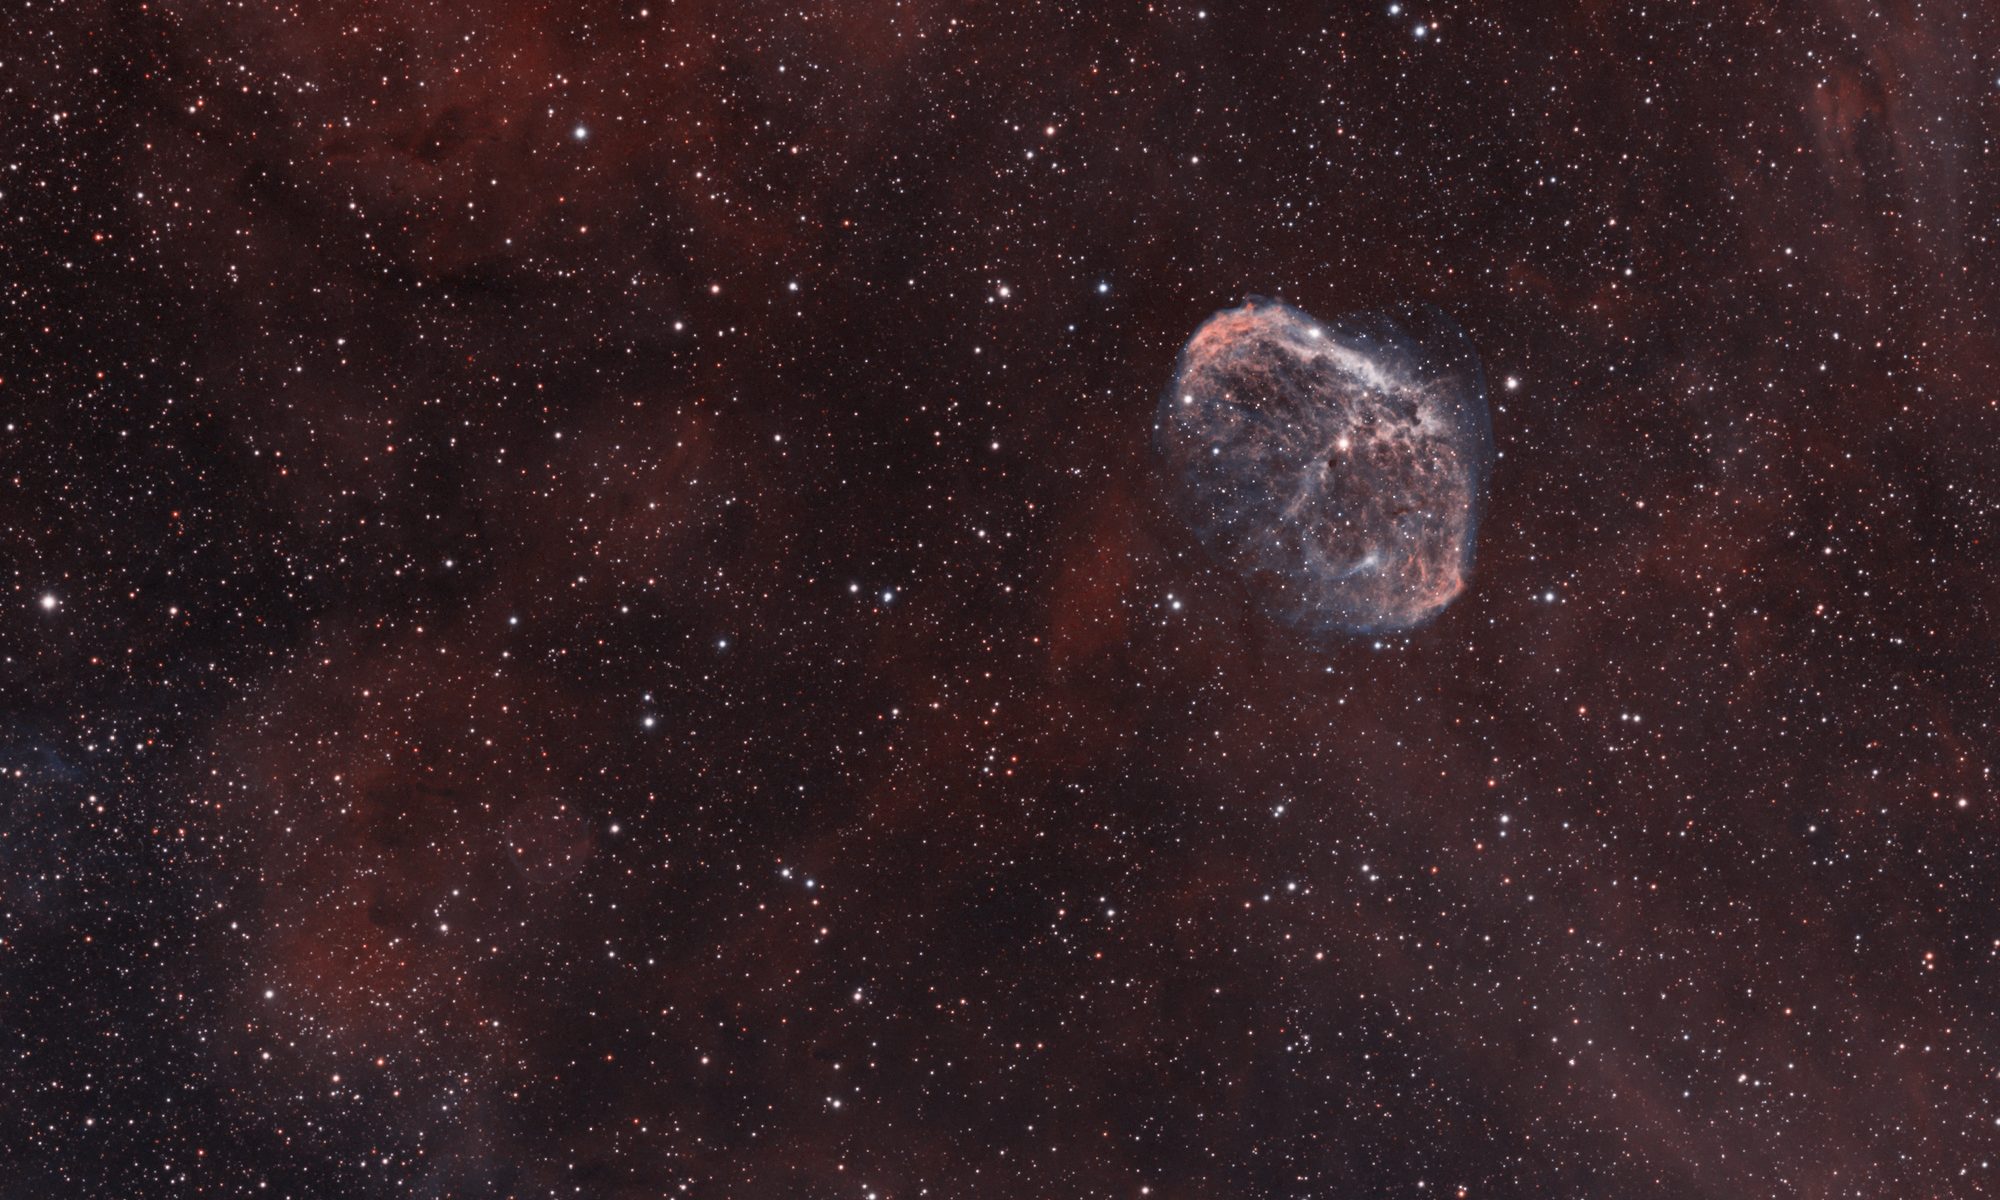
The color of ionized oxygen is green in my image. Other photos may show it as bluish-green or cyan. The actual color is in indeed cyan. This discrepancy has to do with my camera’s filters. There are many decisions when purchasing filters, chief among them is how they handle ionized oxygen, so-called OIII regions at 501nm wavelength. OIII is right at the dividing line between the green and blue filters. My green filter passes nearly all of the OIII light; relatively little passes through the blue filter. Other manufacturers design their filters to pass equal amounts of OIII in both the green and blue filters, giving you cyan. This highlights the challenges of properly imaging emission nebulae. All other colors are accurate, including star colors.
You may have noticed a faint reddish cast to the leftmost two-thirds of the image. This is not light pollution. It is the Milky Way.
William Optics 71mm f/5.9
Atik 314E CCD (cooled but not set-point)
Optolong LRGB filters
Unitron Model 142 German Equatorial Mount (GEM) — 50 years old.
Tracking: Own design Periodic Error Correction (PEC) using stepper motor and Raspberry Pi.
Flat-fielder: Own design “The Flatinator”
Exposure:
Luminance (binning 1×1): 30x 60s
Red (binning 2×2): 30x 73s
Green (binning 2×2): 30x 45s
Blue (binning 2×2): 30x 61s
Flats: 50 each filter
Darks: 50 each filter
Bias (1×1): 100x 1ms
Bias (2×2): 100x 1ms
Total Integration Time: 120m
Captured with INDI/Ekos running Astroberry on Raspberry Pi.
Processed in Astro Pixel Processor (APP) and GIMP.
White Balancing using a method described by Al Kelly: “White Balancing RGB Filters with a G2V Star”
Bortle 5 site
Transparency: Above Average
Seeing: Average
Awesome image and great explanation. I guess you could just tweak the green in post processing? But you might indeed need a mask to protect the stars, which is a feature of PI.
Two years ago when I started, I trialed PI but found it difficult to get my head around, so maybe if I tried again I would be successful. As a consequence I now strive to capture data as perfectly as possible to avoid having to do massive cleanup in post-processing. I get a great deal of satisfaction doing minimal work in APP to get good results without fuss. I may never win APOD with that attitude but the way I see it I am here to please myself not others.
May I ask a question? Do you know of any software that enables me to visualize a target given the Bortle number of my skies? I understand that sky glow puts a hard limit on how much faint nebulosity I can capture. In a typical night I can acquire a complete LRGB sequence in 2 hours. I get good results but then I wonder if I do another 2 hours will I see significantly more nebulosity or have I reached the limit given my skies. I know that capturing more data is always beneficial but you quickly reach the point of diminishing returns. I know that many times I drool over great images on AB but then wonder if my skies will support it. In my image of M27 I see that I am just starting to pick up faint nebulosity in the outer lobes. I figure I'll capture another 2 hours but will I be pleased or disappointed? I think it would be great if there was software to help answer that question, to see a visual representation of the extent of nebulosity that is possible to capture.
Thank you.
Oh, but having your focus on getting your raw data as good as possible is always a good idea. Having good data to begin with enables you to go back to it when you learned more. APOD's are also not always about who has the best post-processing. You may want to try the tools tab (9) to get the green down a bit, I'm not sure, but I thought APP already protects the background a bit when doing that.
Regarding capturing more data... yes that always helps. No matter the sky glow, if you get a decent image out of your data, adding more of that will give you more signal in the end. Certainly when you only did LRGB separately for 2 hours total, getting that up to 4 or even 8, 16 will help. Just a matter of trying it and seeing for yourself, if it doesn't add enough given the effort it takes, you know you can keep it at shorter total length. Here I found a list of objects that are clearly visible in city light area's: https://www.astroleague.org/al/obsclubs/urban/urbanld.html And you can always go from that and find fainter ones to test and see what works. I lived in New Zealand for a year (coming from the super polluted Netherlands) and it was a night and day difference in the quality I could achieve, also for the more bright objects. So my interest in taking pictures in the Netherlands again is very low at the moment, but if that's simply the place you have, you make the most out of it. 🙂 And going for narrow-band will help a lot as well.
Edit: regarding narrow-band or very dark skies; loooong subs will get your better data compared to a lot of short subs. Without narrow-band or light polluted area's, it's better to go for a lot of shorter subs.
